

Transparency in VC: Measure What Matters to Improve Coverage and Performance
Transparency in VC: Measure What Matters to Improve Coverage and Performance
DDVC #69: Where venture capital and data intersect. Every week.

👋 Hi, I’m Andre and welcome to my weekly newsletter, Data-driven VC. Every Thursday I cover hands-on insights into data-driven innovation in venture capital and connect the dots between the latest research, reviews of novel tools and datasets, deep dives into various VC tech stacks, interviews with experts, and the implications for all stakeholders. Follow along to understand how data-driven approaches change the game, why it matters, and what it means for you.
Current subscribers: 17,715, +405 since last week
Brought to you by Gravity - easy-to-use & affordable sourcing tool for data-driven VCs

Gravity tracks exclusive, real-time insights on brand-new startups which allows you to quickly:
Be the first to know when founders leave to start new companies
Know the moment founders go into secrecy or debut their startup out of stealth mode
Discover new startups not found using other data sources
We track billions of data points to help you stay ahead of the fast-moving startup landscape by uncovering startups the moment they hit the web.
VC feedback cycles are long. Very long. It’s an outlier business and returning cash from early-stage investments can easily take a decade or more.
“Once is luck, twice coincidence, but three times is a skill.”
Early-stage venture is hard because you don’t know if you’re any good for long time. Can Limited Partners (LPs) afford to wait decades before committing to a new fund? Can General Partners (GPs) afford to wait decades to promote their junior investors? Of course not. So how can we get more visibility, earlier?
In this post, I’ll share ideas to quantify short-term VC performance. I’ll talk about deal coverage and miss rates across sectors, stages, and geographies; deal conversion rates, cohort performance, and more. It’s an attempt to create more transparency and allow GPs, LPs, and individual team members benchmark themselves and course correct sooner.

What Can VC Firms Learn From Startups
If you ask GPs what their team is doing this quarter, most of them don’t know (although they pretend to). They lack visibility about the resources spent and the balance between new deal sourcing, due diligence, portfolio value creation, fundraising, internal projects, and a lot more. It’s all very qualitative and biased.
Isn’t it ironic that VCs scrutinize startups and drill down each and every metric when investing but they don’t spend a second measuring what matters in their own business?
Imagine a SaaS startup tells you “yeah, we’re doing well and are the best in the market”. Would you accept this and leave them off the hook? Surely not. You’d ask for various KPIs to get a better understanding of the business. ARR, MoM/QoQ/YoY growth, net dollar retention, funnel conversion, burn, you name it (if you’re interested, I contributed to a report on which KPIs matter for companies to raise a growth round here).
On the contrary, when LPs ask GPs about their recent performance and coverage, you’ll most likely hear something like “yeah, we see every startup and have comprehensive coverage”, showing you all the same qualitative logo funnels. And surprisingly, this is accepted and LPs let them off the hook🤯
Why is venture the only industry that gets away with this?
VC has long been a cottage industry that has seen little innovation. This is particularly surprising as VCs themselves are the ones backing the most disruptive businesses. They have a front-row seat when it comes to the adoption of new technologies and business model innovation, yet in the first 60 years following the industry’s inception in the 1950s, the only change was the shift from pen & paper to computer & MS Office.
The reason for this lack of innovation is most likely the absence of competition and pressure to change. Access to capital for startups with less traditional business models and a lack of collaterals has historically been heavily constrained. This is why the VC industry evolved in the first place and, unfortunately, this reality is still true for the majority of new startups today - (source “10 Predictions About the Future of VC”)
While culture and lack of competitive pressure seem like reasonable explanations, it cannot be acceptable and VC as an industry needs to mature. We need to become better. In our own interest to course correct earlier. Distinguish good from bad initiatives. Promote great investors, coach good investors, and let go bad investors.
Measure What Matters
In an attempt to professionalize our own organization, we introduced a range of new metrics at Earlybird several years ago. Since then, we continuously added new and improved existing ones. If we didn’t perceive them valuable, we got rid of old ones.
I’m happy to share some of them below for other VCs to adopt and start benchmarking, to eventually make our industry more efficient, effective, and transparent. And allow LPs to pick the best GPs.
Definitions
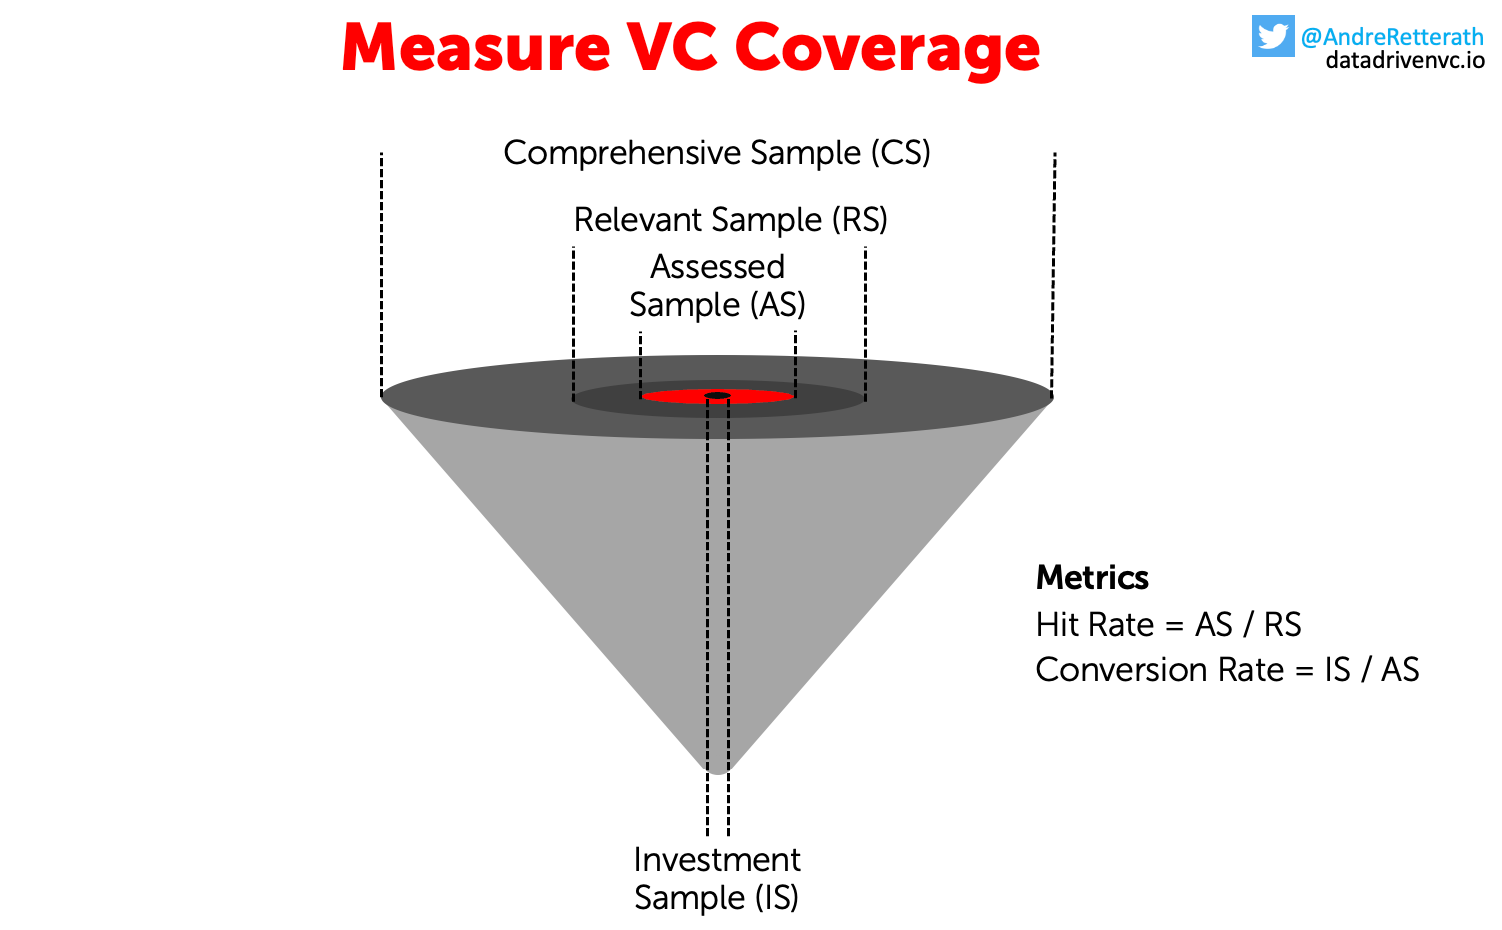
From top to bottom, the sample narrows down into more granular subsamples along the investment process.
Comprehensive Sample (CS): All startups that fit an investors hard criteria (stage, industry/technology/sector, geography). It’s impossible to fully measure this sample as it includes unknown unknowns like stealth companies. Hence, it’s useless to claim full coverage on CS.
Relevant Sample (RS): All startups that got funded by competitor VC firms. Create one list of all VC firms investing within your own hard criteria, mark the ones where if they’ve done an investment, you would have at least loved to have a look at the startup. Triage these VC firms into 3 groups according to relevance/level of competitiveness to your own firm. Get investment information from public registers, match the VC firms to the legal fund entities, and create a bottom-up sample of all investments done by the list of competitor VC firms within a specific period of time. The resulting startup sample is the RS.
Assessed Sample (AS): All startups that got assessed by your own firm. CRM systems like Affinity integrate with your calendar and mail client to automatically track with which founders your team has interacted. Sometimes manual matching between people (and their email) and startups is required, but overall it’s quite accurate already. The spectrum for “assessed” ranges from “interacted with founder” over “pitchdeck uploaded” to “full assessment note/memorandum added to the CRM” but eventually depends on each VC firm’s definition. For Earlybird, “assessed” needs to tick all of the three boxes.
1st Meeting Sample (1MS), 1st Deal Flow Call Sample (1DS), 2nd Deal Flow Call Sample (2DS), Investment Committee Sample (ICS), Term Sheet Sample (TSS): Respective samples represent companies across the investment funnel.
Investment Sample (IS): Investments done.
Metrics
Based on these descriptions, we calculate coverage, conversion, and performance.
Relevant Coverage (RC) = AS / RS
It’s the percentage of relevant deals that your firm sees. We also call it “Hit Rate (HR)” and the inverse the “Miss Rate (MR)”
Calculation requires sample matching between AS and RS. I wrote about “How to Create A Single Source of Truth” before - Happy deduplication ;)
Sample splits based on hard criteria such as geography or sector of the underlying startups allow you to assess your RC more granularly. For example, what’s your RC within a specific country? Comparing numbers across subsamples allows you to steer your sourcing efforts across geographies or evaluate the respective investment professionals more quantitatively.
Tracking RC over time allows you to spot trends and measure the impact of initiatives like new hires on the ground, angel programs, events, etc.
Conversion Rates: Calculate and track conversion rates between and across stages in the investment funnel to measure signal vs noise. Obviously, we want to see all of the below CRs as close to 1 as possible. Some examples:
1st Meeting Conversion Rate (1MCR) = 1MS / AS
Term Sheet Conversion Rate (TSCR) = TSS / AS
Win Rate (WR) = IS / TSS
Performance: Take note who sourced a deal, which source did the deal come from, and who was the deal team that qualified and won the deal. Then measure time to follow-on funding and multiple on invested capital (MOIC) to create cohorts and “dollars generated per period” per individual investor (sourcing, deal-making) and per individual source. This segmentation allows you to granularly track performance, attribute it to people and sources, and leverage these insights for developing talent internally.
The list of metrics goes on. You’re using software to augment your investment process? Nice! But how important is that software? How many deals can you attribute to data-driven sourcing? What’s the performance for software sourced deals vs human sourced deals? How much time do people spend in your tool vs other tools? You have a platform team? Nice! But what’s their impact on portfolio value creation? Do you measure founder and C-Level NPS? How much time do you allocate per company? Is it the outlier companies or do you spend more time supporting the middle or lower bucket of performers?
Similar to startups, VCs should have tens of metrics to track their short-term performance. To course correct and improve on a regular, short-term basis. Not on a multi-year (or decade long) fund-by-fund basis.
Not Everyone Likes the Scoreboard
You cannot escape numbers and data, and not everyone likes this. Again, culture is a big blocker and many people won’t like if you start tracking performance across the team. It’s a sales mentality and many investors will try to preserve the cottage industry vibes.
Make sure to stay GDPR compliant and explain to everyone why this matters. You won’t be able to avoid a natural selection in your team but in exchange your performance might drastically improve. Plus you and your LPs can finally benchmark youself against other funds, and you can play your cards better. Best coverage in geo X? You got it! Best conversion in sector Y? Well done!

Conclusion
If there’s one thing to take away from this post, it’s that VC needs to mature and become more transparent. One way to achieve this is by introducing more short-term measures and complementing qualitative assessments and long-term financial KPIs with more short-term operational measures.
The three most important measures introduced in this article are:
Relative Coverage (RC) = Assessed Sample (AS) / Relative Sample (RS)
Investment Conversion Rate (ICR) = Term Sheet Sample (TSS) / Assessed Sample (AS)
Win Rate (WR) = Investment Sample (IS) / Term Sheet Sample (TSS)
These and all other metrics introduced above help you to comprehensively understand your coverage across geographies and sectors, your ability to focus on the most important deals (that convert into investments) and remove noise, and eventually develop your talent internally and steer your firm’s strategic initiatives with more visibility.
Stay driven,
Andre
Thank you for reading. If you liked it, share it with your friends, colleagues, and everyone interested in data-driven innovation. Subscribe below and follow me on LinkedIn or Twitter to never miss data-driven VC updates again.
What do you think about my weekly Newsletter? Love it | It's great | Good | Okay-ish | Stop it
If you have any suggestions, want me to feature an article, research, your tech stack or list a job, hit me up! I would love to include it in my next edition😎