

Data-driven Fund Management Techniques
Data-driven Fund Management Techniques
Forecasting, Scenario Analysis, Reserve Planning & More

👋 Hi, I’m Andre and welcome to my weekly newsletter, Data-driven VC. Every Tuesday, I publish “Insights” to digest the most relevant startup research & reports, and every Thursday, I publish “Essays” that cover hands-on insights about data-driven innovation & AI in VC. Follow along to understand how startup investing becomes more data-driven, why it matters, and what it means for you.
Current subscribers: 20,404, +390 since last week
My first episode of Data-driven VC had the title “Why VC is broken and where to start fixing it”. The most interesting takeaway is that around 2/3 of the value in VC is created in the sourcing and screening stages. Said differently, VC is a finding and picking the winners game.
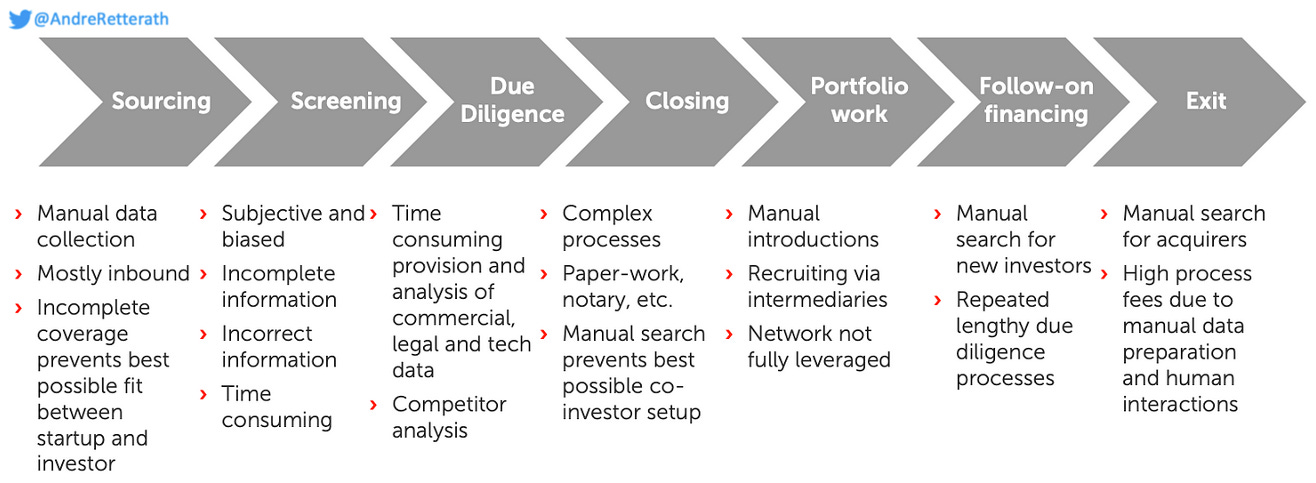
Practical experience seems to nicely align with the literature as most Data-driven VCs started leveraging technology exactly in this sequence: top-down through the funnel. Last year, we were finally able to support this qualitative assumption through actual data from the “Data-driven VC Landscape 2023”.
On this note, we’re about to conclude the data collection for the 2024 edition of the landscape, but preliminary results from 200+ submissions clearly show that the adoption of data-driven initiatives continues to propagate through the value chain, now presenting more use cases for due diligence, portfolio value creation, but also back office functions.
Today, I’m excited to have Anubhav Srivastava, Founder and CEO of Tactyc contribute a guest post to explore what data-driven approaches beyond sourcing, screening, and due diligence can look like.
Thank you Anubhav for sharing how modern investors can leverage data-driven approaches across fund management functions below.
The Data-Driven Fund Manager
The “data-driven” venture fund manager is a term that has gained popularity in recent years. The rise of AI algorithms, data science, and access to larger datasets have increased the quantitative rigor at traditional venture funds. But what does it really mean to be “data-driven” when it comes to portfolio management and planning?
There is a school of thought, that to be data-driven, a fund manager must
Have access to proprietary data
Run complex algorithms or simulations (i.e. Monte Carlo simulations)
At Tactyc, we work with hundreds of data-driven managers globally in helping them with portfolio construction, reserve planning, and portfolio management functions. In our work, we have consistently seen the same common patterns and workflows in our best-performing managers.
Interestingly, we’ve concluded that being “data-driven” doesn’t necessarily mean the most sophisticated algorithms, custom-built software, or complicated Monte Carlo simulations. Instead, the most data-driven investors mostly work with simple quantitative methods - but follow them in a disciplined manner across all their processes, repeatedly and consistently.
In this post, we’ll summarize the most common patterns and workflows that we see successful data-driven managers employ.
Maintaining a Forecast Post-Close
Most managers build a portfolio construction model when raising capital, but very few actually maintain a forward-looking model of their fund after deploying capital. In fact, most portfolio constructions never get opened after the fund is launched. A current forecast is a live forward-looking view of fund performance that takes into account actual portfolio companies.
The fund’s current forecast is built by combining the following:
expected performance of actual investments and their reserves. This is typically done by forecasting upside, downside and base exit scenarios for each portfolio company
expected performance of undeployed capital. This is usually assumed to be the same performance as the original construction plan

Course Correction
Once the manager starts building and maintaining a current forecast for the fund, they can answer the following questions:
Pacing: Are we on track in capital deployed? On the number of portfolio companies in total and by stage?
Changing Market Conditions: Are valuations and round sizes meaningfully different than when we launched our fund and built our original construction plan? If so, how should our allocations or check sizes change in response to the market?
Investment Terms and Reserves: Are our actual investment terms meaningfully different from our original assumptions? Are we getting our target ownership in each company? If not, what can we change going forward?
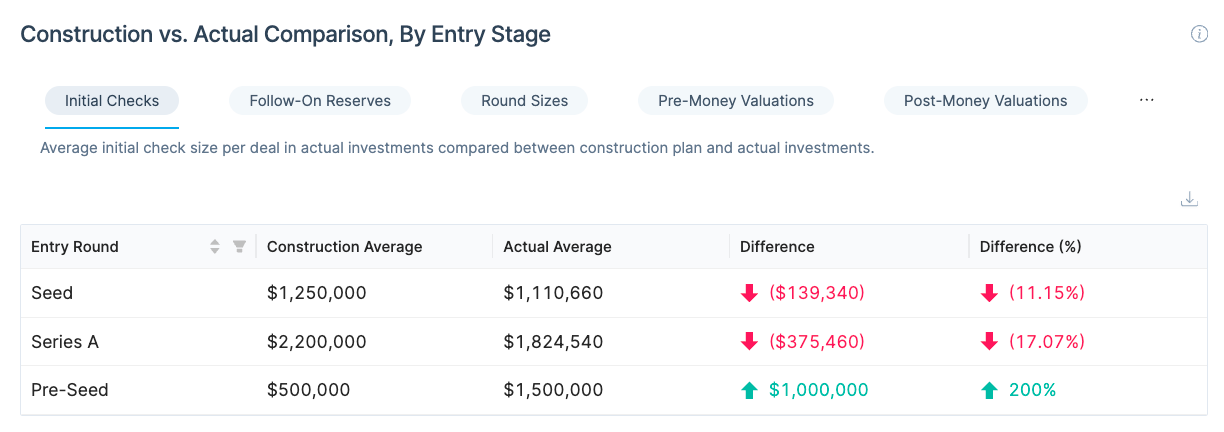
These questions are typically asked every 6 months or each quarter in deep internal reviews and allow the investment team to course-correct should actual performance start to meaningfully deviate from projected returns.
The benefit of having a flexible current forecast model is that the manager can input new assumptions for strategies to apply on undeployed capital and immediately see the impact on returns. This allows the manager to understand what they need to execute to get back on track.
Risk-Weighted Scenario Analysis on Portfolio Companies
Over the life of your fund, your view of each portfolio company’s potential will continue to evolve and become more refined as they demonstrate product-market fit (or not), growth (or not), and a likelihood of exit. New competitors, changes in TAM, management team changes - these can all heavily influence exit outcomes.
Most data-driven managers we work with create the following scenarios for each deal:
Base Case
1x Case
Write-Off Case
Moderate upside
IPO or Home-run case
Each of these cases is then assigned probabilities and each case might have a different set of reserve assumptions as well.

A “weighted average” performance is then computed that summarizes the expected MOIC and expected reserves for each deal.
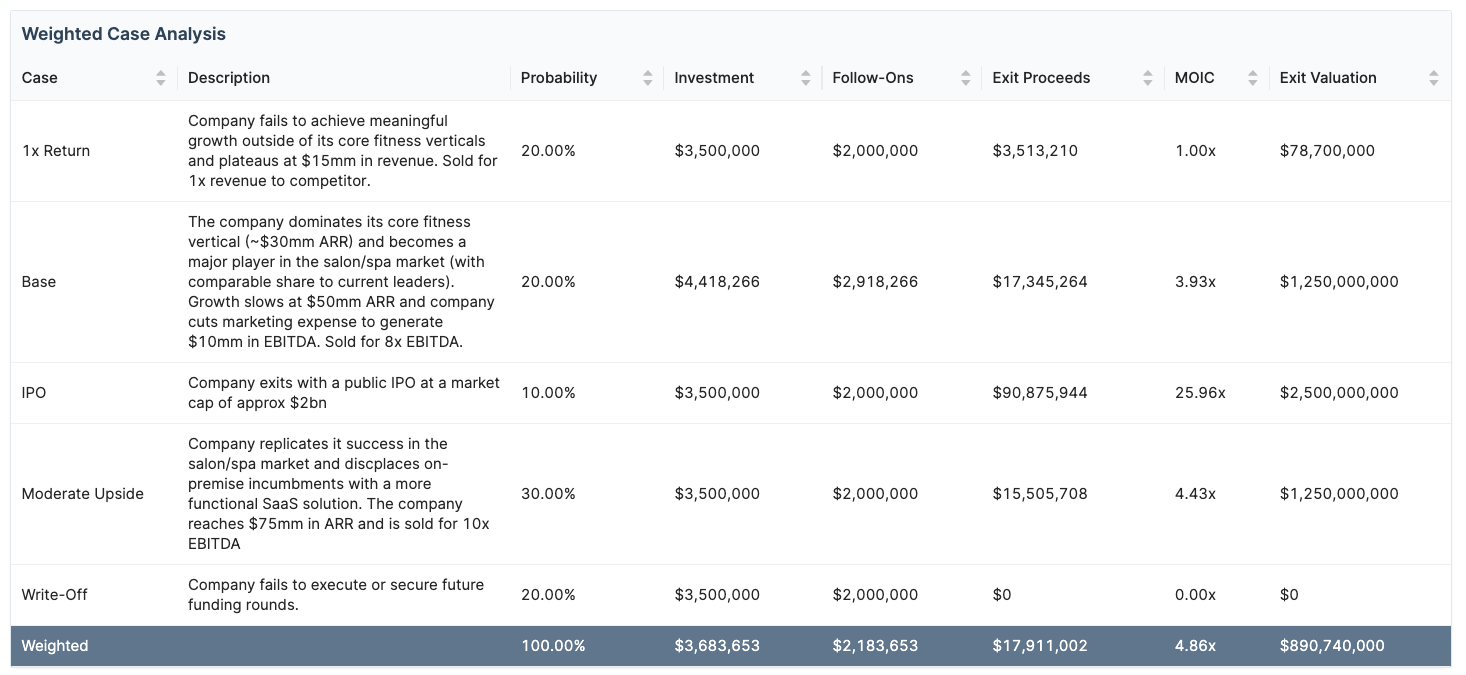
These probabilities are evaluated each quarter as part of an internal review - and changed depending on the dynamics of the company and its market.
The benefit of this approach is that it forces the manager to monitor and even quantify risk on each deal and as a response dial up or down their reserves depending on these risk levels.
Optimizing Reserves Based on Objective Metrics
Reserve allocation decisions can often be driven by subjective criteria such as the relationship with the founder and the need to “back your winners”. While there are certainly merits to follow-on from a signaling perspective - a truly data-driven approach requires viewing reserve allocation from an opportunity cost analysis and answering this question:
Is the next $1 best spent on this company, another company, or a new initial check?
To evaluate this, managers need to calculate a Follow-On MOIC (i.e., what is the expected return on the next $1 into each company). If a manager has built risk-weighted scenarios (see #3 above), this analysis becomes fairly straightforward.
In Tactyc, we compute the expansion in share price between a follow-on round and potential exits to come up with the Follow-on MOIC and then each portfolio company is ranked based on this Follow-On MOIC.

The Follow-on MOIC enables managers to compare portfolio companies in different markets, stages, and risk levels on an “apples-to-apples” basis.
The reason this works is that the manager is now taking into account all quantitative and qualitative factors, such as growth, TAM, management team, and competition, for each deal when building the deal-level forecast. The Follow-On MOIC implicitly quantifies the outcome of these factors.
When viewed with this objective lens, a manager might even be surprised by conclusions that may seem counterintuitive at first. They might see a “beloved” company rank low or a “smaller” investment appearing high on this list - and these are precisely the types of situations that this workflow is intended to uncover.
Converting RVPI to DPI Opportunistically
LPs want to invest in funds that are thoughtful and responsible stewards of their capital. This goes beyond your investment strategy and extends into thinking about how and when you distribute funds back to your LPs.
One way to do this is to evaluate opportunities to sell partial stakes in investments in order to realize gains (and cash) that may not only create early DPI for your investors but also have a positive impact on your fund returns. There is a point at which receiving some cash today instead of waiting years for a greater total amount of cash actually increases your IRR.
Most data-driven managers we work with ask this question - what is the minimum valuation we should sell (part of our stake in) this company today in the secondary market, for our IRR not to be affected? And if the answer is less than (or close to) the current valuation of the company, then that creates a very actionable opportunity for the fund to actively realize DPI today.
In Tactyc, we automatically calculate the minimum sale valuation today for each active investment.

A drawback to this strategy is that there may be a loss in TVPI, so the manager must believe that
future market outlook will deteriorate even further and want to lock in gains today and either distribute or re-invest the realized proceeds into other sectors, or
they have held the investment long enough or an exit is far enough off to warrant locking in some initial gains even if the company is expected to continue to outperform.

Tracking KPIs for Actionable Insights
Lastly, most funds track company performance KPIs through their information rights. These are typically revenue figures, cash balances, burn rates, cash runways, etc. However, how the manager acts upon this data can be critical in not only monitoring existing investments but can also inform future investment decisions.
Valuation Analysis
Some data-driven managers take the revenue collected for portfolio companies and combine them with the valuation data to compute revenue multiples on their entire portfolio. This can then inform portfolio-level or sector-level revenue multiples - and how that is trending over time.
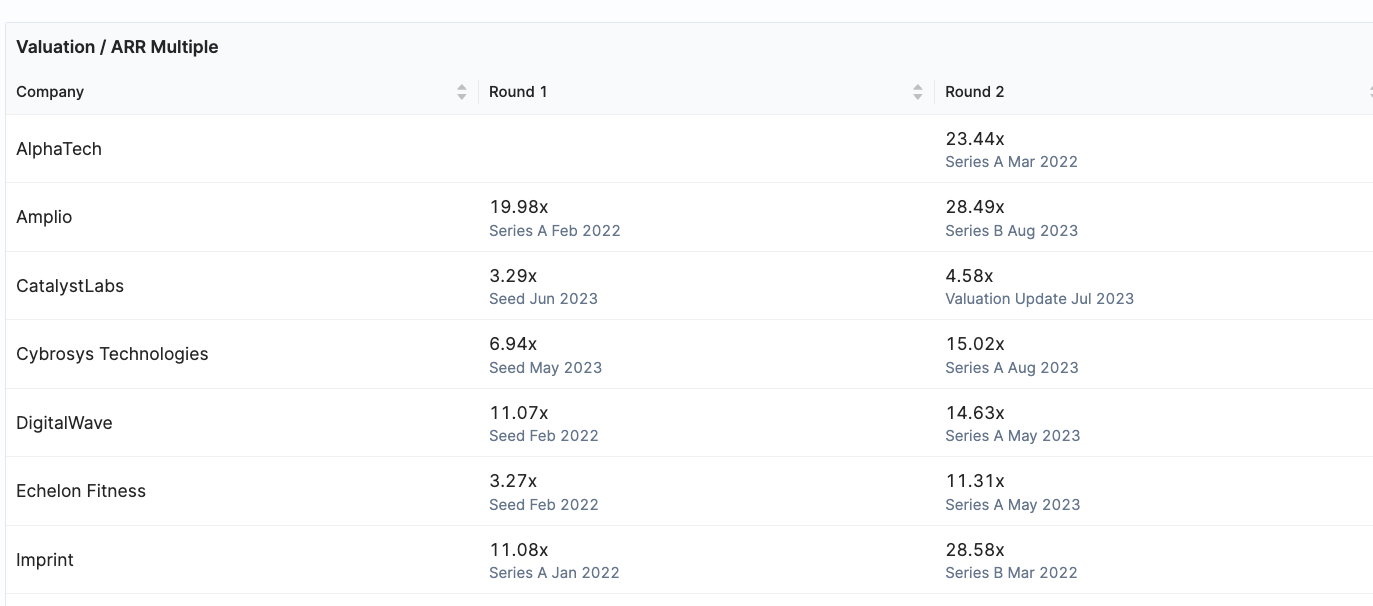
This analysis can also be further parsed out into revenue multiples for individual sectors (SaaS vs. Commerce for e.g.) to understand if the fund revenue multiple is largely in line with the broader sector. And finally, by evaluating revenue multiples and their trajectory, the fund can also be better informed on whether valuations for deals in the pipeline are in line or meaningfully different from their current portfolio companies.
Fund as Company Analysis
Another interesting KPI-based analysis answers the question:
What would the fund look like if it were a portfolio company? What would its average cash balance be? What would its average revenue and burn rate be?
This is typically calculated based on the weighted ownership into each portfolio company. In Tactyc we do this automatically and the results are summarized in a dashboard
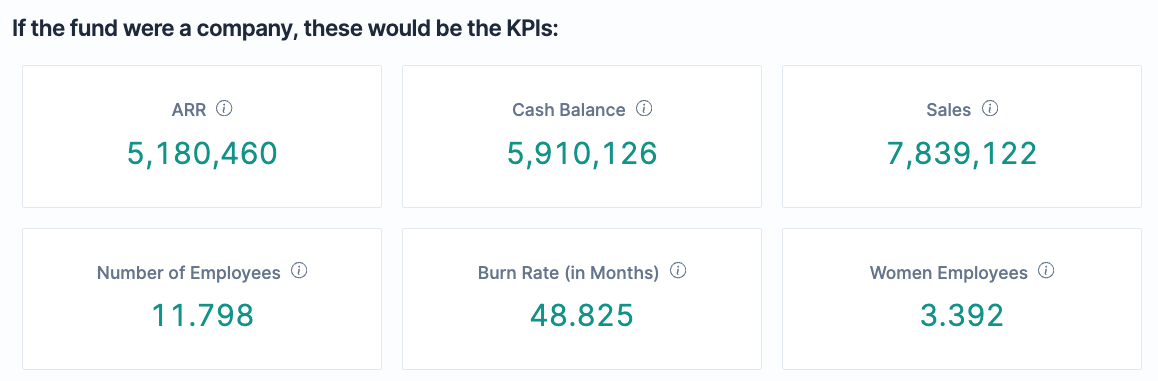
This analysis is a quick and easy to “gut check” the health of the entire portfolio and understand if there are areas of concern across the entire portfolio.
Closing Thoughts
These quantitative workflows are accessible to every fund manager, established or emerging, and can be done in spreadsheets or software such as Tactyc. The key is to follow these workflows in a disciplined and consistent manner and work with a live current forecast of your fund at all points in time.
In our experience, building and maintaining these models in spreadsheets is resource intensive and not a trivial exercise - which is why we built Tactyc, so every manager can be empowered to deploy these workflows quickly and efficiently.
See more details on Tactyc and schedule a demo.
This is it for today. I hope you enjoyed this guest post and would love to hear your thoughts on the format and what other areas you’re interested in.
Stay driven,
Andre
Thank you for reading this episode. If you enjoyed it, leave a like or comment, and share it with your friends. If you don’t like it, you can always update your preferences to receive just the regular Thursday “Essays”, just the Tuesday “Insights”, or both. Subscribe below and follow me on LinkedIn or Twitter to never miss data-driven VC updates again.
What do you think about my weekly Newsletter? Love it | It's great | Good | Okay-ish | Stop it
If you have any suggestions, want me to feature an article, research, your tech stack or list a job, hit me up! I would love to include it in my next edition😎