

Founder Salary Benchmark, Sizing ESOP, "Normal" Burn Rates, Optimal Team Size & More
Founder Salary Benchmark, Sizing ESOP, "Normal" Burn Rates, Optimal Team Size & More
Digesting Insights From the Data

👋 Hi, I’m Andre and welcome to my weekly newsletter, Data-driven VC. Every Tuesday, I publish “Insights” to digest the most relevant startup research & reports, and every Thursday, I publish “Essays” that cover hands-on insights about data-driven innovation & AI in VC. Follow along to understand how startup investing becomes more data-driven, why it matters, and what it means for you.
Brought to you by Compass - The New Data-Driven Platform From Landscape

Compass is the first full-stack OS for investors looking to become data-driven. We help forward-thinking venture funds:
Unlock full market visibility through data-driven sourcing
Drive efficiencies in manual screening workflows
Automate monitoring startups on their watchlist
Join leading global venture funds using Compass today.
This is the third episode of my new “INSIGHTS” series. I’ll publish it every Tuesday and it comes in two alternating formats:
“DIGEST” the most interesting startup research & reports from the previous two weeks. We read all reports, studies, and papers about startups and the wider ecosystem, and condense the most important insights for you. The only source you need to keep up with data-driven startup insights.
“SYNTHESIZE” all available research to create a deep knowledge base for various startup topics such as success criteria, founder backgrounds, hiring playbooks, salary benchmarks, cap table structures, and more. The only source you need to understand any specific startup topic.
Today, we continue with DIGEST#2, summarizing the most relevant research from the past two weeks and highlighting six clear takeaways.
Equity Evolution: Navigating ESOPs in Startup Growth
Sizing Employee Stock Option Pools (ESOP) is crucial to attracting and retaining top talent. Yet, founders oftentimes lack the benchmark of what’s market standard and what’s off. Thankfully, Carta ran the numbers for 28k US companies and found:
Negotiation Necessity: ESOP becomes a pivotal point in discussions with VCs, demanding founders to strategically plan their equity distribution to accommodate future hiring needs.
Trend Tracking: An uptick in ESOP utilization reflects the challenges companies face in fundraising, prompting them to extend the life of existing option pools. Interestingly, equity distribution saw a shift, with the first ten hires in recent years receiving more than those in positions 10-100 compared to earlier cohorts.
Vesting Variations: While a 4-year vesting schedule with a one-year cliff remains standard, emerging trends include varied vesting terms and early exercise options.

✈️ KEY TAKEAWAYS
As startups navigate their growth, managing equity burn becomes as critical as cash burn to prevent valuation and ownership dilution. Depending on initial team composition, ESOP starts with around 13% fully diluted at Pre-Seed and Seed and grows to about 20% fully diluted at unicorn valuation. Full analysis here.
Deciphering the "Normal" Burn Rate for Startups
Navigating the financials of a startup, especially understanding burn rates, is more art than science, as evidenced by a recent survey of over 700 SaaS companies. Here's what we've learned about the elusive "normal" burn rate:
No One-Size-Fits-All: The ideal burn rate is a myth. It's highly contextual, depending on a company's cash reserves, investment strategies, and the expected return on those investments.
Shifting Benchmarks: Today's burn rates have plummeted from the highs of 2021/2022. For SaaS ventures in the $20-$50M ARR range, the median monthly burn rate has dramatically decreased from $1.5M in 2022 to just $100-150K in 2023.
Size and Growth Impact: High-growth companies with $20M+ ARR tend to burn around $1M per month, with only a small fraction breaking even or turning a profit. Conversely, lower-growth companies with $1-5M ARR have significantly lower burn rates of about $50K per month, with a quarter achieving breakeven or profitability.
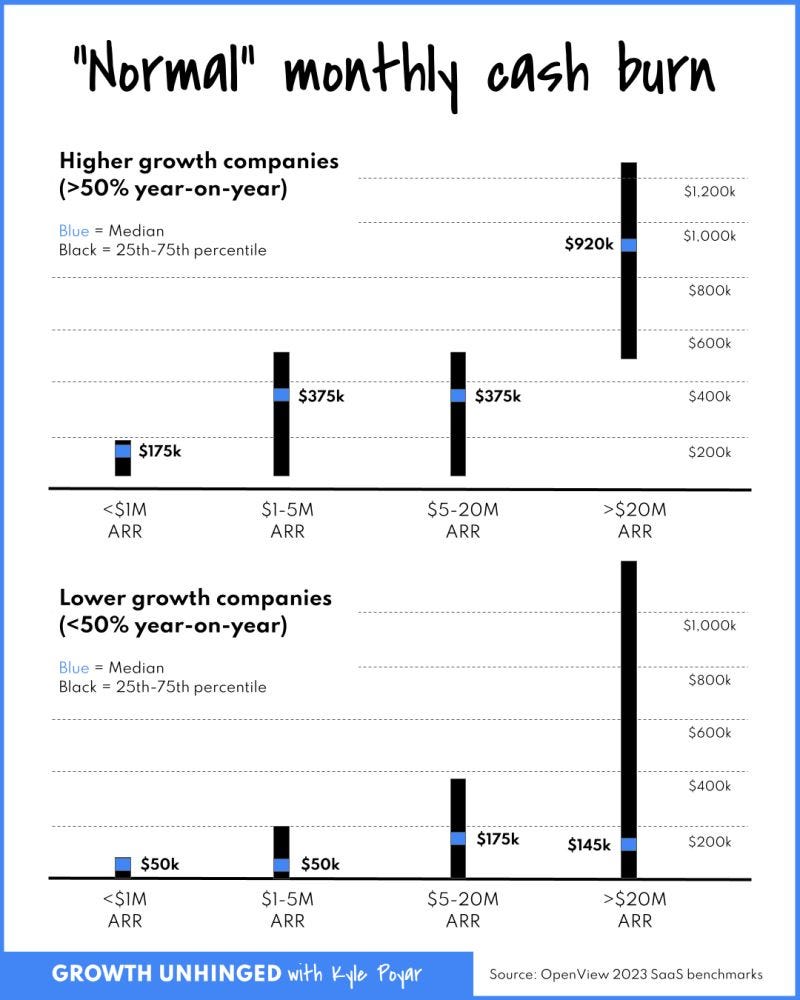
✈️ KEY TAKEAWAYS
The concept of a "normal" burn rate is fluid, deeply influenced by a company's growth phase, market dynamics, and strategic direction. While recent trends show a marked reduction in burn rates, companies must remain agile, prepared for strategic adjustments and potential cost reductions to align burn with growth trajectories. Original post here.
Also relevant in this context: BVP’s recent “Rule of X” concept shows that different from the “Rule of 40”, growth is higher valued than profitability.
Maximizing Startup Runway when Funding Dries Out
Now that you have an idea of “normal” burn rates, you might wonder how to reduce spend. SaaS spending might just be the lever to pull. With capital harder to come by, optimizing SaaS spending has emerged as a crucial lever for efficiency.
Audit and Trim Unused Licenses: A staggering 40% of organizations report up to 19% of their SaaS spend is wasted on unused or underutilized licenses. Proactive audits can uncover that over 30% of licenses on some platforms are ripe for elimination, offering immediate cost savings.
Combat Shadow IT: Shadow IT comprises 30% to 40% of IT spending in large enterprises, highlighting the need for rigorous audits and policies to curtail unmanaged software acquisition, thereby preventing budget leaks and enhancing security.
Negotiate Early and Wisely: Early renewals and skilled negotiations can lead to lower costs and better terms, aligning SaaS expenditure with long-term financial planning.

✈️ KEY TAKEAWAYS
By focusing on these data-backed strategies, startups can not only extend their runways but also foster a culture of fiscal discipline and strategic resource allocation, ensuring sustainable growth in a competitive landscape. Full report by CrunchBase here.
Blasting Off to Unicorn Status: The Graduate Degrees That Give You Wings
Ever wonder what it takes to join the ranks of unicorn founders? Stanford’s Ilya Strebulaev analyzed 1400 US VC-backed startups to shed light on the graduate subjects that correlate with unicorn valuations. Here's the rundown:
Aerospace/Aeronautic: A staggering 1.7x higher likelihood of founding a unicorn company compared to their peers!
Medicine and Computer Science: Graduates in these disciplines aren't far behind, each boasting a 1.4x increase in their chances.
Materials Science: A slightly polished edge, with a 1.1x likelihood.
However, not all fields show the same promise. Degrees in Political Science, Biology, and Law indicate lower chances of achieving unicorn glory.
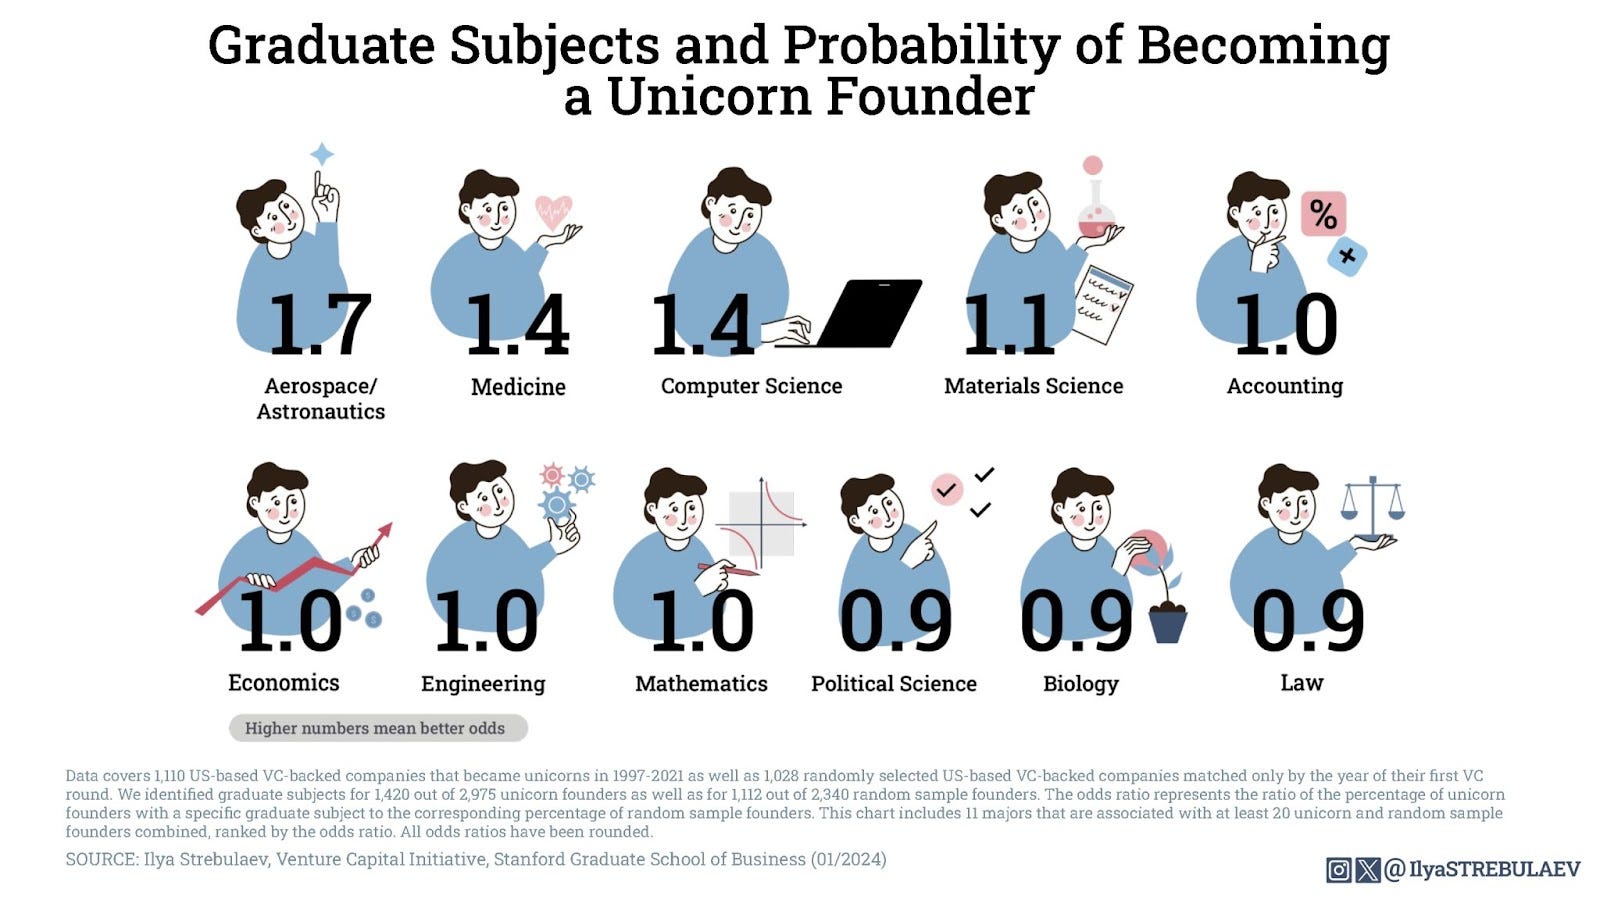
✈️ KEY TAKEAWAYS
While certain fields of study seem to be positively correlated with entrepreneurial success, the results are not to confuse with causation. Read the full analysis here.

Let's Talk Founder Compensation: Navigating the Early Stages
In a push towards transparency in founder compensation, our friends at Creandum and Slush have released their latest annual report, shedding light on what 700 early-stage founders in Europe are taking home.
Stability in the Face of Uncertainty: Despite the fluctuating economic landscape, founder salaries at early stages remained largely unchanged from 2022 to 2023, with bonuses largely being put on hold, indicating a cautious approach amidst financial uncertainties.
The Geographic and Sectorial Divide: UK founders continue to lead in compensation, although there's a noticeable dip across the board — a trend mirrored in the fintech sector, which, despite a decrease, still stands atop the salary spectrum.
A Closer Look at Equity and Roles: The survey highlights a persistent pay gap and representation issue, with CROs (Chief Revenue Officers) often out-earning CEOs, reflecting the premium placed on revenue generation and commercial acumen in today's market.
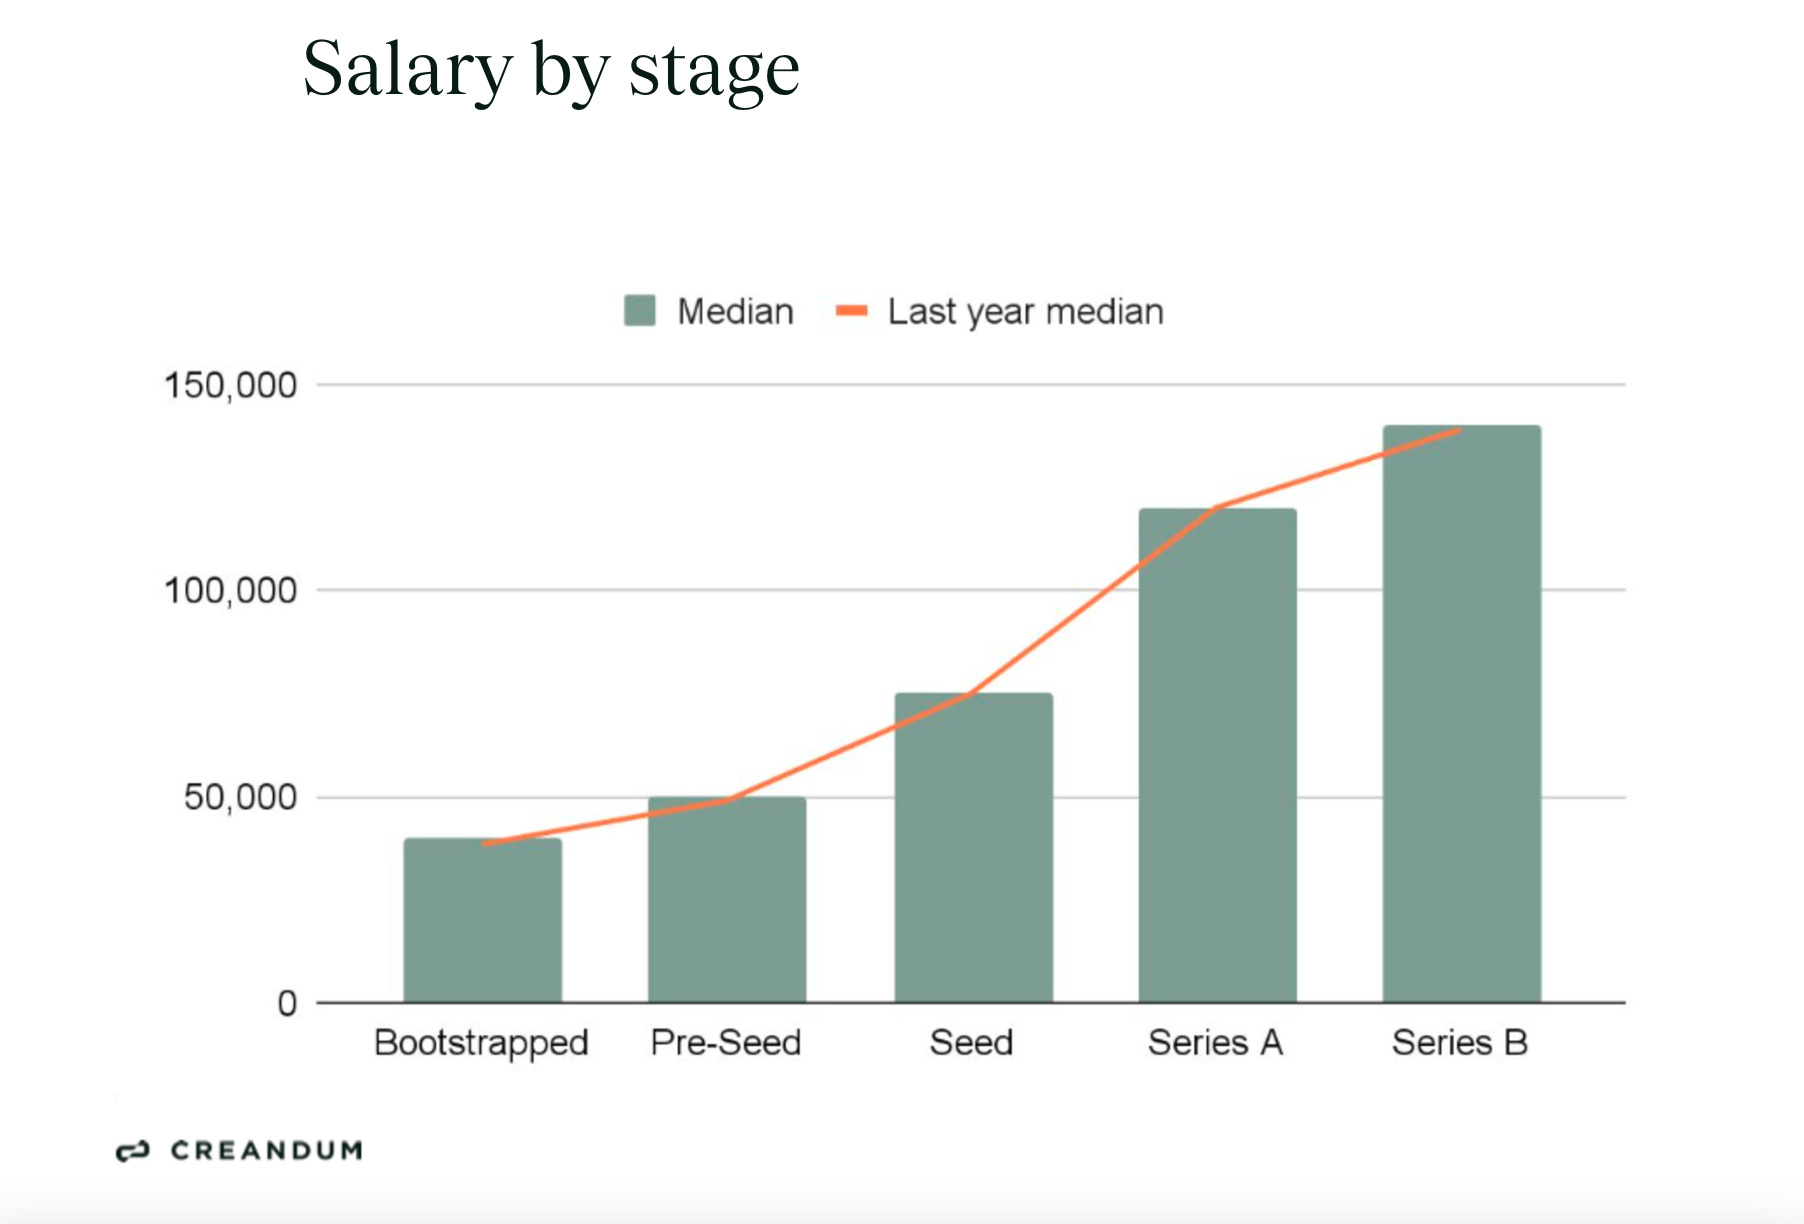
✈️ KEY TAKEAWAYS
Results indicate a cautious compensation climate where early-stage salaries hold steady and bonuses become rare, except in self-funded ventures. The data also casts a spotlight on the UK's continued dominance in founder earnings, despite a universal downturn, and underscores the premium on roles directly tied to revenue generation. Full report here.
Building the Optimal Team Size for SaaS Success
A deep dive by Kyle Poyar into over 700 SaaS companies sheds light on optimal team sizes and composition, crucial for navigating the path to $50M+ ARR. Key findings include:
Engineering as the Backbone: Engineering remains the largest department. However, its proportion has adjusted, decreasing from 40% to 31% of total staff for companies with <$1M ARR, suggesting a shift towards more balanced team structures.
Strategic Departmental Focus: Different business models dictate hiring patterns. PLG companies favor engineers and PMs, while Enterprise SaaS leans towards Professional Services, indicating a tailored approach to scaling.
Specialization in "Other" Departments: As companies mature, there's a trend towards specialized roles in areas such as HR/People Ops and Legal, moving away from the early-stage generalist approach.

✈️ KEY TAKEAWAYS
For SaaS companies, the key to scaling effectively lies in adapting team composition to both the growth stage and business model, ensuring a balanced and strategic approach to building out departments. Original post by Kyle here.
Thanks to Jérôme Jaggi for his help with research for this post.
Stay driven,
Andre
Thank you for reading this episode. If you enjoyed it, leave a like or comment, and share it with your friends. If you don’t like it, you can always update your preferences to receive just the regular Thursday “Essays”, just the Tuesday “Insights”, or both. Subscribe below and follow me on LinkedIn or Twitter to never miss data-driven VC updates again.
What do you think about my weekly Newsletter? Love it | It's great | Good | Okay-ish | Stop it
If you have any suggestions, want me to feature an article, research, your tech stack or list a job, hit me up! I would love to include it in my next edition😎