

Data-driven VC #23: How to measure productivity and identify potential for improvement
Data-driven VC #23: How to measure productivity and identify potential for improvement
Where venture capital and data intersect. Every week.

👋 Hi, I’m Andre and welcome to my weekly newsletter, Data-driven VC. Every Thursday I cover hands-on insights into data-driven innovation in venture capital and connect the dots between the latest research, reviews of novel tools and datasets, deep dives into various VC tech stacks, interviews with experts and the implications for all stakeholders. Follow along to understand how data-driven approaches change the game, why it matters, and what it means for you.
Current subscribers: 5,970, +120 since last week
I ended last week’s post with the following conclusion:
“I’m convinced that the application of data-driven approaches allows most VC firms to become a better, more successful version of themselves. Given the significant impact for new and just evolving VCs, even an 80/20 out-of-the-box solution (like an off-the-shelff e-bike) makes a huge difference. Don’t overcomplicate it, just start with something and avoid getting stuck in the “buy-versus-build bubble”
This last statement has sparked a number of great comments and DMs, all in the same vein of: “Yes, this is us and although we urgently want to become more data-driven, we’re stuck. We tried to work with freelancers/devs building our own solution, struggle to find the right off-the-shelf tools etc.” Well, the good news is that you’re not alone. Your current state probably applies to the majority of VCs out there.
Where to start your journey to become a data-driven VC?
Although I won’t be able to provide you with a silver bullet answering all of your questions, I dedicate this post to sharing a framework that may help you identify the strengths and weaknesses of your current setup, reveal the potential for improvement and help you to prioritize next steps to becoming more data-driven.
To start off, we first need to understand the status quo both qualitatively but also quantitatively. Simple but powerful: “If you can’t measure it, you can’t improve it”. Let’s look at the individual components and bring them together thereafter.
Qualitative status quo
There are two major components on the qualitative side: The tool stack and the investment process. We need to visualize both before getting into the quantitative part.
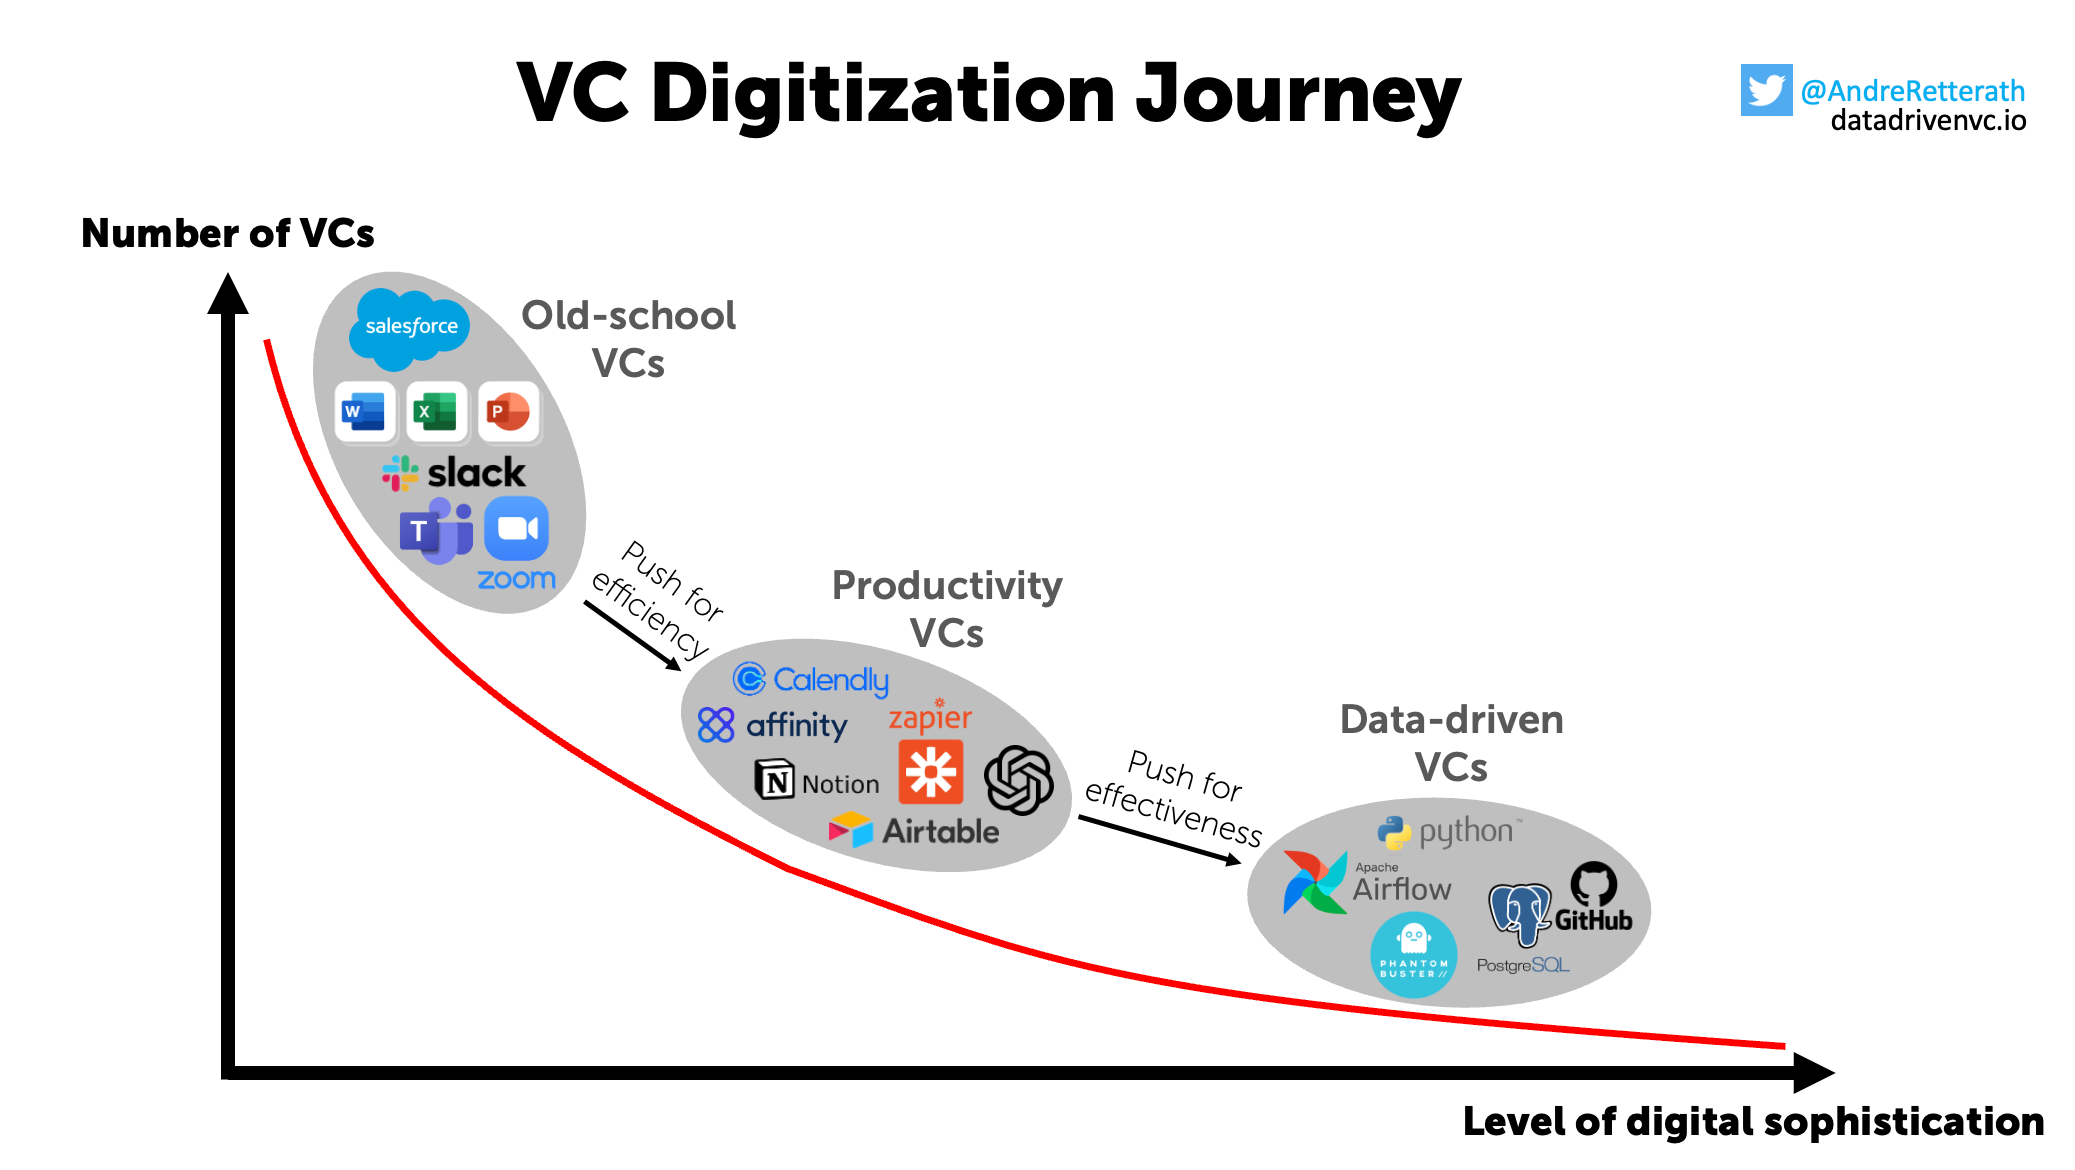
Tool stack: Following the lines of my previous “VC Digitization Journey” post, tool stacks look different depending on your individual stage of the digitization journey. Generally, the more advanced the stack, the more fragmented it becomes. As a result, you’ll lose plenty of time switching contexts without even noticing it. Ask your team about the tools/websites in usage, you’ll be surprised by the diversity and oftentimes redundancy, e.g. some using Google Meet while others use Zoom or Teams - within the same team🤯
Summarize all solutions (and associated costs) that make up your tool stack.
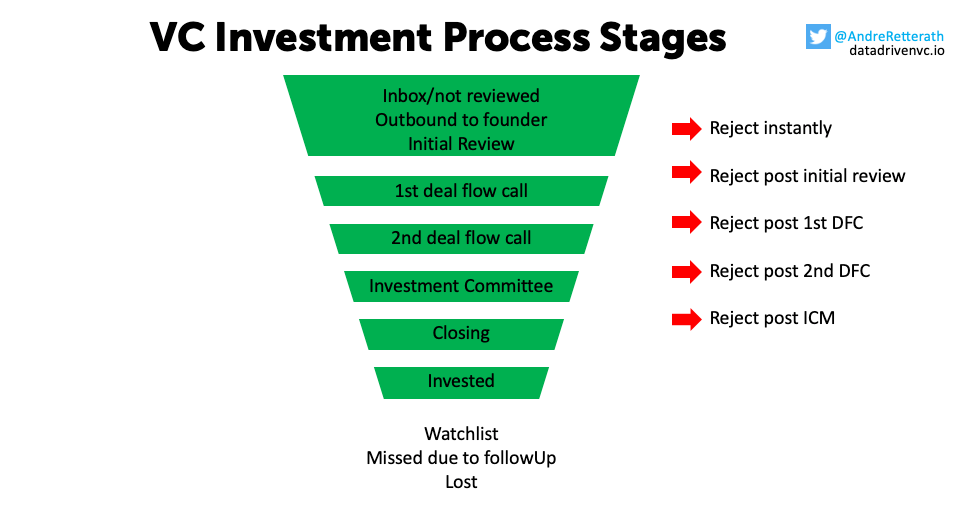
Investment process: Same same but different. On a high level, every VC investment process (excluding impact funds) looks more or less the same though sometimes details differ. The figure below shows the different stages of an exemplary investment process. The different stages are typically the “status” fields in a VC CRM system to track every investment opportunity through the process.
Visualize all stages (=status labels) of your investment process.
Quantitative status quo
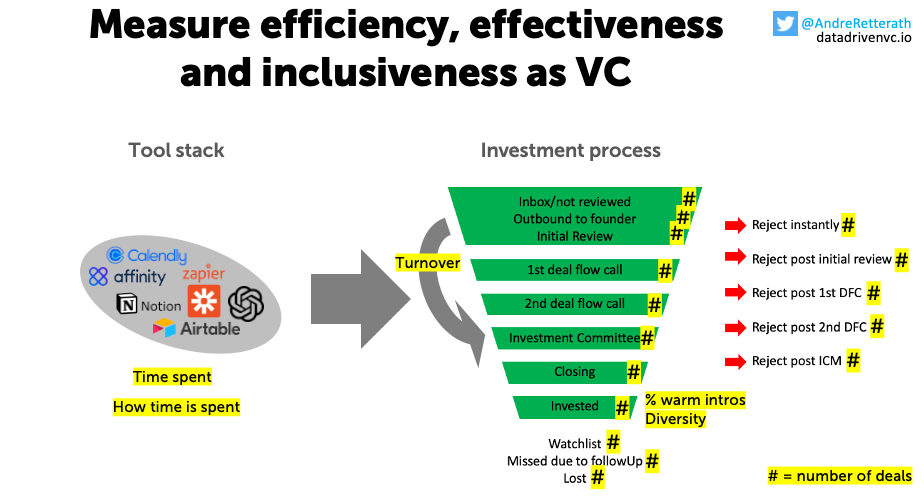
Relating to my overall vision of leveraging data to become more efficient, effective and inclusive, let’s look into all three dimensions and try to understand how we can measure them and what the potential impact of data-driven approaches may be.
Efficiency: The ratio between input and output. The higher the ratio, the more efficient. In our case, input is the time of the investment team and output is the number of deals processed (yes VC is an outlier business and quality is more important than quantity, I know, read on to “effectiveness”). For more granularity, we split the input into two sub-components “how much time is spent” and “how time is spent”.
The “how much time is spent” shall be constant as we assume that the investment team would not work more or less and not hiring/firing people. Moreover, we can split the overall time spent by stages across the investment process to generate more insights. If we apply the same split on the output side, i.e. number of deals processed in the respective stages, we can measure efficiency quite well across individuals and the team. For example, 8 hours per week spent on “outbound to founder” and “initial review” stages translating into 30 new deals added to the CRM system would mean 16 minutes per new opportunity.
The only way to improve this efficiency ratio (=generate more output with the same input) would be to change “how time is spent”. No surprise.
Hypothesis on the potential impact of data-driven approaches: Automate the majority of the tasks (like described in my “10x Productivity with ChatGPT” post) and create a single source of truth to reduce the need for context switching.Input = time spent (across process stages) + how it's spent (across tools)
Output = number of deals (across stages)Effectiveness: In short, VCs want to identify the right opportunity at the right point in time and be in the best position to strike a deal. To achieve this, you need comprehensive coverage top of funnel, signals and insights to prioritize the right opportunities, short turnover times to meet the timelines of the founders and strong positioning to convince them to partner with you.
Coverage can be measured by the number of deals top of funnel. Please note that this is mostly a vanity metric as it only provides valuable insights once you know the full universe of opportunities (which can only be approximated) and can calculate the relative coverage. Still, the number of deals top of funnel by itself allows you to track your own progress over time and beat your past self.
Prioritization can be measured by the number of missed opportunities (=deal not in CRM system but a competitive investor invested; calculate either absolute or relative as percentage share of overall coverage top of funnel). Turnover can be measured as the time between the initial review and the positive decision. And, lastly, the ability to win deals can be measured as the number of lost opportunities (=positive decision but lost against other funds; calculate either absolute or relative as percentage share of the number of positive decisions).
Hypothesis on the potential impact of data-driven approaches: Converge towards comprehensive coverage top of funnel (as described in my “How to not miss an investment opportunity anymore” post), reduce the number of missed opportunities (as described in my “How to automate startup screening” post), shorten turnover times and be in a better position to win competitive deals (e.g., by providing useful market and competitor insights, metrics benchmarking etc.)Coverage = number of deals top of funnel
Missed opportunities = deals done by competitors not in CRM
Turnover = time between initial review and positive decision
Lost opportunities = positive decision but lost against competitorsInclusiveness: VCs are gatekeepers and although talent is distributed equally, capital and opportunity are not. My goal is to make VC more inclusive by removing the need for warm introductions, meeting the founders where they are, supporting more diverse teams and a lot more. This can be measured by the percentage of investments that got sourced through warm introductions, diversity of gender, educational backgrounds, country of origin, etc.
Hypothesis on the potential impact of data-driven approaches: Reduce the relative share of investments that originated via warm intros by proactively identifying promising founders based on their digital footprint. While I believe we might be able to identify “less-polished” founders that might not even know about VC as a funding option (=increase the diversity of founders), I’m not so sure what the potential impact of data-driven approaches can be on educational or gender diversity across teams that we invest in.Percentage of investments sourced via warm intros
Diversity across gender, education, origin etc.
Merging all pieces together
While effectiveness and inclusiveness can be quantified based on output-related measures alone, efficiency requires us to add input-related measures and connect them with the output. I tried to include all measures in the merged figure below (thanks, I know I’m a design wiz 😎)
With all of these measures in place, you should be able to comprehensively measure your firm’s status quo and get a good feeling about your strengths, weaknesses and potential for improvement. Insights will become even stronger when tracking these measures over time. The higher the frequency, the more useful the insights.
Big team but still low coverage and high miss rates? You were in touch with the founders some time ago but only learned from other VCs that they recently reached an inflection point? Dropped the ball as you had too many opportunities on the table and wrongly prioritized? Always too late to the party because of slow turnover? Got everything right, but still losing the majority of the deals against competitors?
Conclusions will be different for every fund and so should the prioritization of your initiatives. Next episode, we’ll dive into various avenues to become more data-driven based on different starting points.
Stay driven,
Andre
Thank you for reading. If you liked it, share it with your friends, colleagues and everyone interested in data-driven innovation. Subscribe below and follow me on LinkedIn or Twitter to never miss data-driven VC updates again.
What do you think about my weekly Newsletter? Love it | It's great | Good | Okay-ish | Stop it
If you have any suggestions, want me to feature an article, research, your tech stack or list a job, hit me up! I would love to include it in my next edition😎
Great content thank you! Just really eager to know what you think the impact funds investment process look like - as you mentioned that it could be different?