

Data-driven VC #15: What social graphs of founders and VCs tell us
Data-driven VC #15: What social graphs of founders and VCs tell us
Where venture capital and data intersect. Every week.

👋 Hi, I’m Andre and welcome to my weekly newsletter, Data-driven VC. Every Thursday I cover hands-on insights into data-driven innovation in venture capital and connect the dots between the latest research, reviews of novel tools and datasets, deep dives into various VC tech stacks, interviews with experts and the implications for all stakeholders. Follow along to understand how data-driven approaches change the game, why it matters, and what it means for you.
Current subscribers: 3,340, +220 since last week
Today’s episode is a dedicated deep dive on social network analysis of founders and their investors, and its ability to reveal otherwise hidden ecosystem insights. Let’s start with the basics.

Constructing a social graph
A social network can be defined as a social structure comprising a set of people, groups and organizations, sets of ties and interactions between the actors. A social graph is a diagram taken from graph theory that illustrates a social network with two basic components:
Nodes represent entities in the network (such as “people” like founders or individual investors or “companies” like startups and VC firms) and can hold self-properties (such as weight, size, color and any other attribute) and network-based properties (such as Degree- number of neighbors or Cluster- a connected component the node belongs to etc.).
Edges represent the connections between the nodes (like money invested or social media following of each other) and might also hold properties (such as weight representing the amount invested or direction of a relationship).
These two basic elements can describe multiple phenomena, such as physical electricity networks, roads network, social connections or - most important for us - a Startup/VC ecosystem. An example graph on an entity level might contain VC firms and startups as two different node types that are connected via unidirectional edges that have weights representing the investment rounds (#1=pre-seed, #2=Seed, #3=SerA etc.).
Another example graph might be on the people level where individual VC investors and founders are two different node types with different sizes representing their Twitter following and that are connected via uni- or bidirectional edges representing Twitter following of each other. Although one could theoretically add new node types, edges and weights without limitation to create a single comprehensive graph, I personally prefer to keep it well-organized with individual graphs for different purposes.
Below is some basic but broadly applicable code that I wrote as part of my research in Cambridge in 2017 to create a social graph based on a CSV file where, following the examples above, every row represents either an investment from a VC into a startup or an individual VC following a founder on Twitter. Node size represents the number of connections. Node color is red for investors and blue for startups, just for plotting and visualization purposes.
import csv
import networkx as nx
import pandas as pd
import numpy as np
import matplotlib.pyplot as plt
import statsmodels
import statsmodels.api as sm

df1 = pd.read_csv("FileName.csv", delimiter=";", decimal=",", encoding = "ISO-8859-1") # Read CSV file with VC-startup relationship into Pandas data frame; decimal changes comma into dots
G1 = nx.from_pandas_dataframe(df1, source="Company name", target="SH Name") # Return a graph from Pandas data frame

# Sets node size equal number of connections
# Sets node color to red if Investor and blue if company
node_sizes = []
node_colors = []
for knoten in G1:
    if knoten.startswith('INV'):
        node_colors.append("r")
        if knoten in node_sizes: continue
        else:
            node_sizes.append(8*len(G1.edges(knoten)))
    else:
        node_colors.append("b")
        if knoten in node_sizes: continue
        else:
            node_sizes.append(1*len(G1.edges(knoten)))

# DRAW NETWORK
nx.draw(G1, node_size=node_sizes,node_color=node_colors, with_labels=False)
What can we do with a Startup/VC social graph?
Before we start with the analysis, let’s distinguish between a snapshot at a specific point in time (static) and a time series of snapshots across time (dynamic). This will be important later on. Probably the most essential method for social network analysis, independent of static versus dynamic, are centrality measures that address the question: "Who is the most important or central person in this network?"
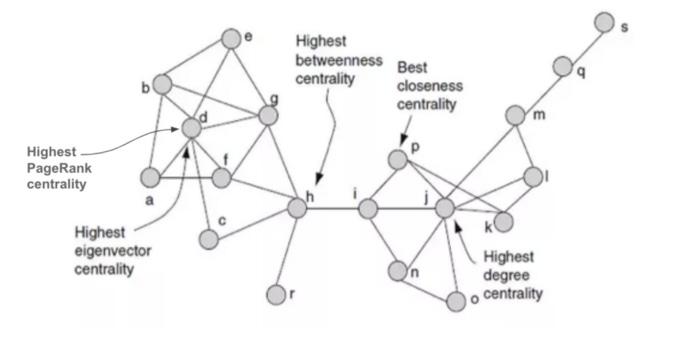
Depending on what we mean by “importance”, there are many different answers to this question. Although Freeman claimed in 1979 that "There is certainly no unanimity on exactly what centrality is or on its conceptual foundations", things have converged in the meantime and researchers seem aligned that centrality measures (BC, CC, DC, EC) are the most suitable measure to analyze social networks. They are calculated for every individual node:
Betweenness Centrality (BC)— the number of times lying on the shortest path between other nodes
When to use it: For finding the nodes that influence the flow around a system
Closeness Centrality (CC)— the level of closeness to all of the nodes
When to use it: For finding the nodes that are best placed to influence the entire network most quickly
Degree Centrality (DC) — the number of direct neighbors of the node
When to use it: For finding very connected nodes that are likely to hold most information or that can quickly connect with the wider network
EigenVector Centrality (EC) — like degree centrality but also considering how many links their neighbors have etc.
When to use it: For identifying nodes with influence over the whole network
Static social graph analysis
By calculating the above centrality measures for our Startup/VC ecosystem snapshot, we receive the first useful insights. For example, we find semi-closed groups of individuals/entities co-investing in the same or across different rounds. These are oftentimes angel syndicates in pre-Seed rounds or befriended VC firms investing in Seed, Series A and onwards that got to know and seem to complement each other well. Studies show that investors with strong social capital (=high centrality) have superior access to information about current investment objects and opportunities to leverage them in the future.
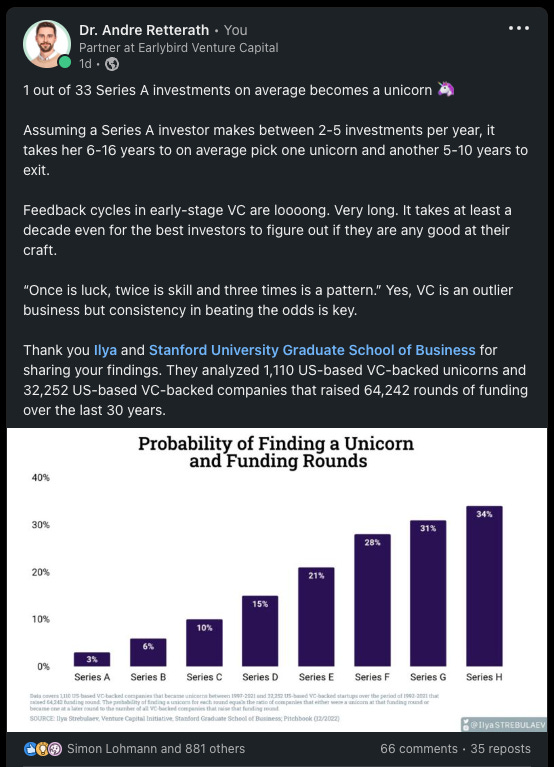
We can leverage the above social graph as of t1 and correlate it with success outputs as of t2, similar to the logic described in my previous episode “how to automate startup screening”, to receive centrality patterns that predict success. In one of my unpublished working papers from 2017, I found a statistically significant correlation between startup success outcomes and all of the above-mentioned centrality measures. More recently, Sifted shared that founders who are well-connected on LinkedIn and Twitter raise 20% bigger rounds than their less-connected peers.

Dynamic social graph analysis
Another interesting approach is to merge all static social graph snapshots and their respective centrality measures into a dynamic time series dataset. Hereof, we can observe how the relative position/centrality of individual actors changes over time. Sequential patterns across investors and funding rounds are called “herding effects”, a research field by itself. For example, if a well-connected, influential and in our measures “highly central” angel A commits to invest in the pre-Seed of a company, then other angels B, C and D will likely follow the signal and co-invest, as they have done before. Subsequently, VC firm E is likely to lead the Seed round and so forth. This positive signaling effect is not to confuse with the widely known negative “signaling effect” that refers to multi-stage firms not participating in follow-on rounds which in turn sends a negative signal to potential follow-on investors. The insights of a herding analysis can help investors to build more intentional relationships with either more upstream investors for sourcing and access or more downstream investors for follow-on funding.
Independent of the development of the centrality measures, we can also introduce deterministic “alert systems” to guide our investment team. For example, we create a list of individual investors at top tier funds, take a snapshot of their personal Twitter social graphs every day and trigger an alert as soon as two or more of them follow (=create edges to) the same individual founder. This easy logic can quickly be fine-tuned to exclude coincidence and deliver insightful scores to cut through the noise of the millions of potential founders and startups to track.
If you’re interested in the topic of social network analysis, I highly recommend the “Applied Data Science with Python Specialization” course from the University of Michigan, hosted by Coursera. Course 5 “Applied Social Network Analysis in Python” is the course you’re looking for, although the other four are also great.
What’s next?
Our rich dataset not only helps us to identify, track and diligence interesting companies, but also allows us to analyze overarching trends and patterns that can be useful for VCs, Founders and Researchers alike. For example, I posted some select insights on “patterns of successful startups” about a month ago and until today it’s the second most read episode of this newsletter. Moreover, I sporadically post insights from diverse researchers via my LinkedIn and Twitter accounts. Compared to most of my other social media content, these “insights from the data” posts attract significantly more attention, just like the “patterns of successful startups” episode mentioned above.
By extension, I’m wondering if I should include short 1-2 minute episodes with one specific research finding, an explanation and a “what does it mean” conclusion in this newsletter more regularly?
Thank you all for helping me improve the quality and impact of this newsletter. Merry Christmas and have some peaceful days with your family!
Stay driven,
Andre
PS: Submit your input for the “Data-driven VC Landscape 2023” by end of the year to receive the full landscape and report before everyone else
PPS: Don’t miss our extensive write-up on “Value accrual in the modern AI stack”
Thank you for reading. If you liked it, share it with your friends, colleagues and everyone interested in data-driven innovation. Subscribe below and follow me on LinkedIn or Twitter to never miss data-driven VC updates again.
What do you think about my weekly Newsletter? Love it | It's great | Good | Okay-ish | Stop it
If you have any suggestions, want me to feature an article, research, your tech stack or list a job, hit me up! I would love to include it in my next edition😎
Interesting finds, if a bit fallacious IMHO :)
Both social network analysis and ML interpretation are associational in nature, not causal.
E.g.: Do more LinkedIn posts cause more funding? Or does more funding cause more LinkedIn posts? Or does a confounder, like better sales or other metrics, cause both more LinkedIn posts and more funding?
Your post (and especially the Sifted article) implies the first causal structure. But I highly suspect it's a combination of the latter two.
Also, conditioning on an outcome (success) additionally creates collider bias.
I.e.: P(tech degree | startup success) =/= P(startup success | tech degree) =/= P(startup success | do(tech degree))
I see people making these spurious correlations so often, it kinda irks me haha.